Web App / UI/UX
SaaS Dashboard
A concept analytics dashboard for a software product, designed so that someone opening it on a busy morning can see what changed and decide what to do about it.
Concept project: a sample of the kind of work we do.
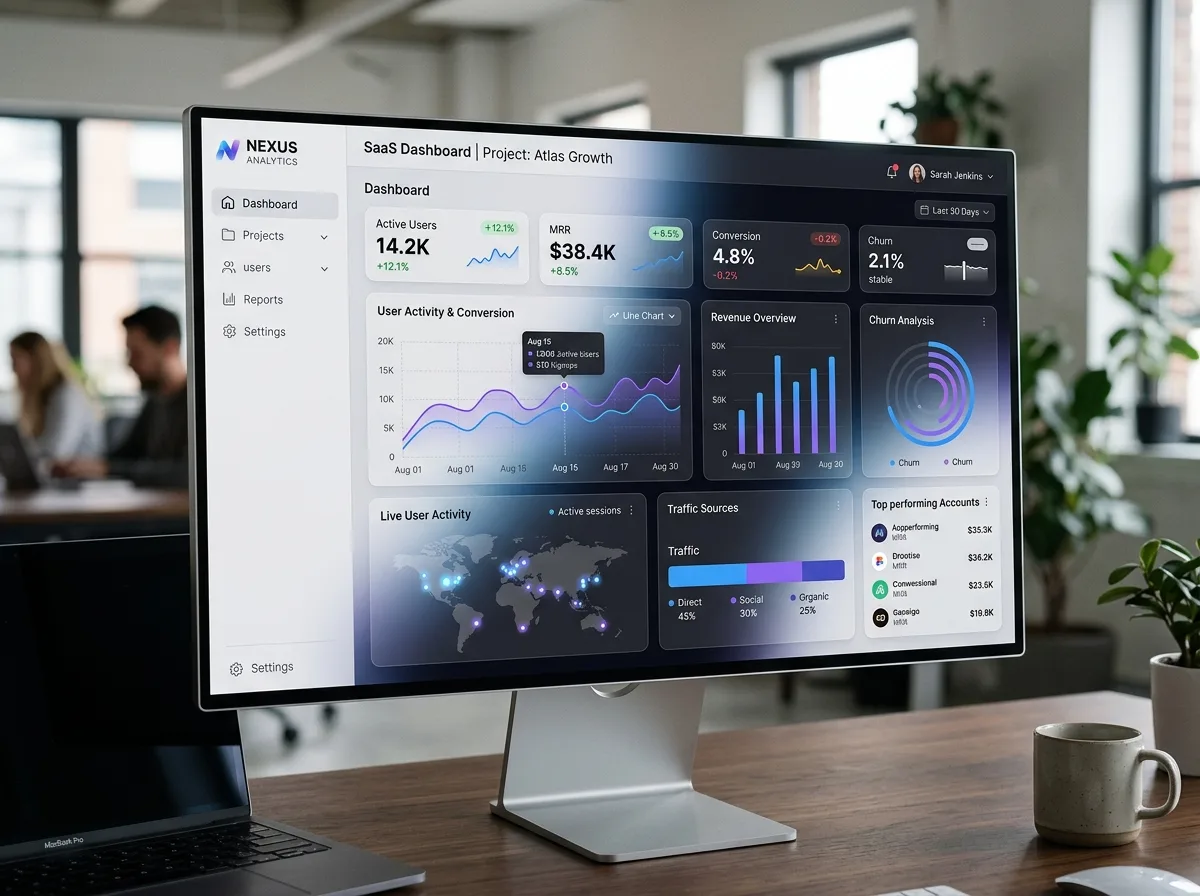
This is a concept piece rather than a client engagement. It looks at how we would approach the main dashboard of a software product, the screen people return to most and judge the product by.
The design thinking
A dashboard fails when it shows everything with equal weight. We start by asking what decisions people need to make from this screen, then work back to the few figures that support those decisions and let everything else sit one level deeper.
Hierarchy does most of the work: consistent spacing, restrained colour reserved for meaning, and charts chosen for the question they answer rather than for variety. Empty, loading and error states get designed too, because new accounts see the empty version first and first impressions count.
What a project like this involves
- Understanding the different roles that use the product and what each needs to see
- Reviewing the available data and agreeing clear definitions for each figure
- Wireframing layouts and testing them with realistic data, including extreme values
- Building a component system for tables, charts, filters and forms
- Designing for keyboard use, readable contrast and smaller screens
Where the effort usually goes
Often it goes into the details that are easy to overlook: long names in narrow columns, tables with thousands of rows, and filters that stay clear about what is being shown. Handling those well is what makes a product feel dependable.